At Mangum Economics, we leverage the best sources of information about data centers to quantify their impacts across North America.
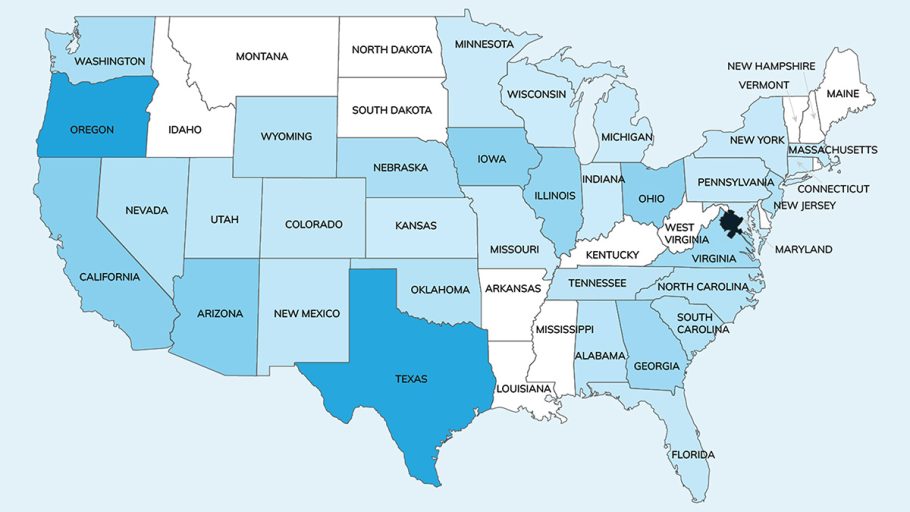
The map shows our calculation of the megawatts of hyperscale and colocation data centers combined, based on information from datacenterHawk from the end of 2023. The shading is directly proportional to the operational critical capacity at the time.
We separated Northern Virginia from the rest of the state. The region alone had as much critical capacity as all of Oregon, Texas, Arizona, Nebraska, and Pennsylvania combined. Northern Virginia is roughly balanced between hyperscale and colocation capacity.
Oregon’s second-place ranking (with 38 percent of Northern Virginia’s capacity) was largely due to hyperscale development around Boardman and Prineville.
Texas was in third place (with 33 percent of Northern Virginia’s capacity) spread across Dallas / Fort Worth, Houston, and Austin (with mostly or exclusively colocation development) and San Antonio (with mostly hyperscale capacity).
Behind those top three regions, the rest of the top ten regions (Arizona, California, Iowa, Ohio, Illinois, Georgia, and the rest of Virginia) were roughly the same size. The data center investment in Iowa and Ohio was almost entirely from hyperscale development. Hyperscale development makes Virginia a top-ten state even without Northern Virginia.

The rest of the shaded states had roughly the same amount of critical capacity, and in most of them, hyperscale investment accounted for almost all of the data center development.
The high rankings of Oregon, Iowa, Ohio, and the rest of Virginia become apparent only after accounting for hyperscale development. Because most of the AI investment is being done by hyperscalers, and hyperscale development attracts colocation development, we expect more intensive development in Oregon, Nebraska, Iowa, Ohio, the rest of Virginia, and the Carolinas.
ABOUT THE AUTHOR
David Zorn advises businesses, trade associations, and governments on the community impacts of critical infrastructure. Previously, he spent over 20 years at the US Food and Drug Administration working on food safety, nutrition, risk assessment, and public health, ultimately serving as Director of Social Sciences. He has published papers on food safety, risk assessment, and data quality. He earned a PhD in Economics from George Mason University.